
|
Proprietary Data Insights Financial Pros’ Top Big Bank Stock Searches in the Last Month
|
||||||||||||||||||||||||||||
JP Morgan (JPM) Just Printed a Record Quarter |
|
This morning, JP Morgan Chase (JPM) kicked off bank earnings season with a record quarter. Net income hit $16.5 billion. EPS came in at $5.94, crushing the $5.46 consensus. Markets revenue set an all-time high at $11.6 billion. Investment banking fees jumped 28%. Financial pros saw it coming. Our TrackStar data shows JPM searches outpaced the #2 bank by more than 25% in the month leading up to the print. Yet shares barely moved in pre-market trading, dipping 0.3%. With JPM down roughly 3% year-to-date on worries about AI capex and Middle East tensions, the question is whether this blowout changes the story. Here’s our take. JP Morgan Chase’s BusinessJP Morgan Chase holds $4.9 trillion in assets, making it the largest U.S. bank. The firm separates itself from peers through scale, technology spend of over $17 billion annually, and a consistently fortress-like balance sheet. Operations span more than 60 countries. Clients range from millions of U.S. consumers to the world’s largest corporations, institutions, and governments. JPM segments its business into the following areas:
Q1 2026 revenue of $50.5 billion rose 10% year-over-year. Net interest income climbed 9% to $25.5 billion. Non-interest revenue jumped 11% to $25.1 billion. The standout was the Commercial & Investment Bank, where revenue grew 19%. Fixed Income Markets rose 21% and Equities climbed 17%. JPM now holds the #1 spot for global IB fees with 9.8% wallet share. On the strategic side, Dimon noted that the U.S. economy remains resilient but flagged geopolitical tensions, energy price volatility, and elevated asset prices as risks. The firm returned $12.2 billion to shareholders in the quarter through dividends and buybacks, pushing the LTM net payout ratio to 82%. Book value per share grew 8% year-over-year to $128.38. Tangible book value per share grew 8% to $108.87. Guidance for FY26 calls for net interest income of roughly $103 billion and adjusted expenses near $105 billion. Financials
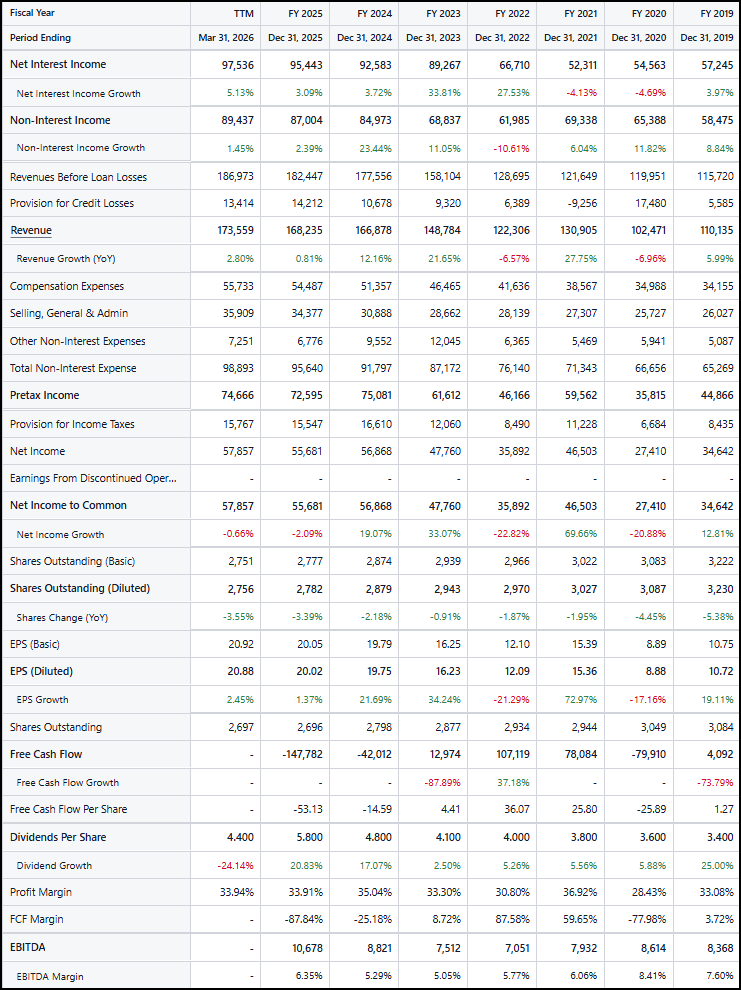
Source: Stock Analysis JPM has compounded revenue at 11.2% annually over the past three years, reaching $173.6 billion on a trailing twelve-month basis. That’s 2.8% growth over the last year as the NII tailwind from rate hikes has largely played out. The profit engine keeps humming. Profit margin holds at 33.9%, and EPS has compounded 18.3% over three years despite a modest 1.4% decline in FY25. Capital returns are aggressive but well-funded. Dividends per share grew nearly 21% in FY25 to $5.80, and the share count has dropped 3.5% over the last year through buybacks. The balance sheet is fortress-grade. CET1 capital sits at $291 billion with a 14.3% ratio. Total loss-absorbing capacity is $572 billion, and cash and marketable securities total $1.5 trillion. Credit costs were $2.5 billion in the quarter, down from $3.3 billion a year ago, with net charge-offs of $2.3 billion. Valuation
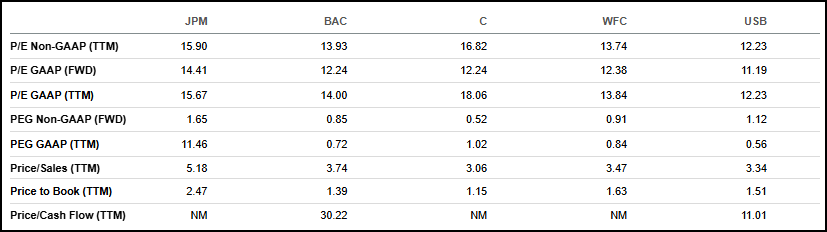
Source: Seeking Alpha JPM trades at a clear premium to its big-bank peers. At 15.9x trailing earnings, JPM commands a higher multiple than Bank of America (BAC) at 14.0x, Wells Fargo (WFC) at 13.8x, and U.S. Bancorp (USB) at 12.2x. Only Citigroup (C) trades higher at 18.1x, though that reflects a lower earnings base rather than quality. On price-to-book, JPM’s 2.5x is the highest in the group, nearly double WFC’s 1.6x and USB’s 1.5x. Price-to-sales of 5.2x also tops every peer. The premium isn’t cheap, but it’s earned. Growth
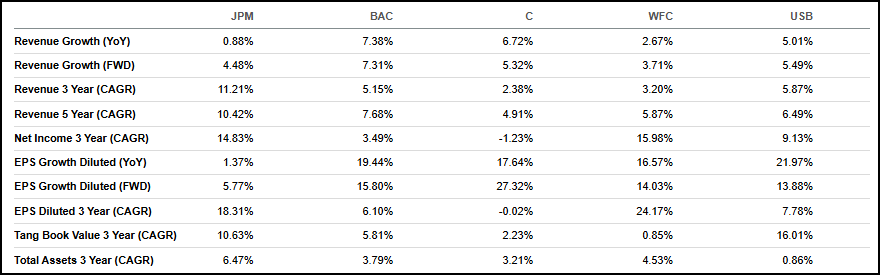
Source: Seeking Alpha JPM’s three-year revenue CAGR of 11.2% leads the peer group by a wide margin, more than double BAC’s 5.2% and nearly triple WFC’s 3.2%. Over five years, JPM has grown revenue at 10.4% annually, again leading every peer. Net income has compounded at 14.8% over three years, second only to WFC’s 16.0%. The catch: forward revenue growth of 4.5% is actually the lowest of the group. Peers like BAC (7.3%) and USB (5.5%) are expected to catch up as the NII cycle normalizes. Forward EPS growth of 5.8% also trails every peer, though off a higher base. Profitability
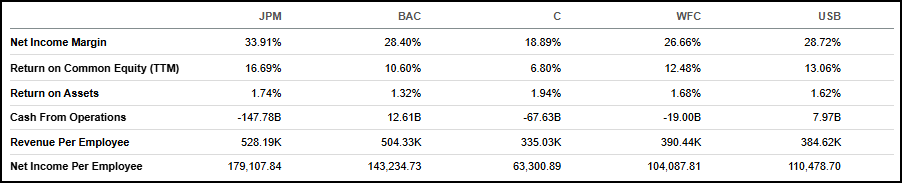
Source: Seeking Alpha JPM’s 33.9% net income margin is the best in the group, beating USB’s 28.7% and BAC’s 28.4%. Return on common equity of 16.7% leads every peer. Return on assets of 1.7% trails only Citigroup’s 1.9%, which is a suspect number given Citi’s profit struggles. Revenue per employee of $528,190 tops every peer, and net income per employee of $179,108 is roughly 25% higher than the next-closest bank. Simply put, JPM generates more profit per dollar of equity and per employee than any of its large-cap peers. Our Opinion 9/10JP Morgan just delivered the best quarter in its history for trading, a record wallet share in investment banking, and 8% book value growth, all while returning 82% of earnings to shareholders. The valuation premium is real. Investors pay the highest P/E and P/B in the peer group. But you’re paying for the highest margins, the highest returns on equity, and the strongest balance sheet among the major U.S. banks. The only reason this isn’t a 10/10 is that forward revenue growth is decelerating, and shares have gotten expensive. Still, for a long-term core holding in financials, JPM remains the standard. |
|
News & Insights |
Just Spilled |
|
Want to get content like this directly to your inbox? Then we urge you to sign up for our newsletter here |